The Tables and Figure Captions are from the report "Status of killer whales in Canada", by R.W. Baird.
TABLE 1. Characteristics which differ between resident and transient-type killer whales in the nearshore waters of the eastern North Pacific.
MORPHOLOGY/GENETICS
Shape of the dorsal fin (Bigg et al. 1987; Bain 1989)
Saddle patch pigmentation (Baird and Stacey 1988)
Possibly eye patch pigmentation (D. Ellifrit, personal communication, cited in Baird 1994)
Mitochondrial and nuclear DNA (Stevens et al. 1989; Hoelzel and Dover 1991; Hoelzel et al. 1998; Matkin et al. 1998)
BEHAVIOUR/ECOLOGY
Diet (Bigg et al. 1987; Morton 1990; Baird and Dill 1996; Ford et al. 1999)
Travel patterns/habitat use (Heimlich-Boran 1988; Morton 1990; Baird and Dill 1995a)
Respiration patterns (Morton 1990)
Vocalizations (Ford and Hubbard-Morton 1990; Morton 1990)
Echolocation (Barrett-Lennard et al. 1996)
Amplitude of exhalations (Baird et al. 1992; Baird 1994)
Possibly diving patterns (Baird 1994)
Group size (Bigg et al. 1987; Morton 1990; Baird and Dill 1996)
Pattern and extent of natal philopatry (Bigg et al. 1987; Baird and Dill 1996; Baird and Whitehead 1998)
Seasonal occurrence (Guinet 1990; Morton 1990; Baird and Dill 1995a)
Geographic range (Bigg et al. 1987)
TABLE 2. Comparison of age-specific mortality rates for all mature female southern residents from 1995-1998 (data from van Ginneken and Ellifrit 1998) with values presented by Olseiuk et al. (1990).
|
Age group |
Olesiuk et al. 1990 residents |
1995-1998 southern residents |
|
15.5-24.5 |
0.0000 |
0.0 |
|
25.5-34.5 |
0.0036 |
0.0 |
|
35.5-44.5 |
0.0109 |
0.05 |
|
45.5-54.5 |
0.0250 |
0.125 |
|
55.5-64.5 |
0.0328 |
0.14 |
|
>65 |
0.069 |
0.05 |
Note to Table 2. While sample sizes are small, and this is a post-hoc comparison looking only at a four-year period where a decline in the population has been noted, mortality rates for mature females between 35 and 65 years of age are four to five times higher than the rates calculated by Olesiuk et al. (1990).
TABLE 3. A summary of causes of mortality or disturbance to killer whales and their potential role in population limitation. Those sections in white are considered to be the most serious threats or limiting factors for killer whale populations in Canada.
|
Threat |
Known or thought to cause population reduction in last 100 years in Canada |
Potential to cause substantial population reduction in future |
Trend in threat |
|
NATURAL |
|||
|
Predation |
No |
No |
NA |
|
Die-offs |
No (but yes with marine mammals elsewhere) |
Yes |
Unknown |
|
Mass stranding or entrapment in ice or narrow inlets
|
Yes |
Yes |
Steady? |
|
ANTHROPOGENIC |
|||
|
Culling/direct killing |
Yes |
Unlikely on west coast, possible in Arctic Canada |
Decreasing on west coast, unknown in eastern and Arctic Canada |
|
Incidental mortality |
No |
No |
Steady? |
|
Live capture |
Yes |
No |
Decreasing |
|
Vessel harassment |
No |
No (but possible contributing effect?) |
Increasing |
|
Vessel collision |
No |
No |
Increasing |
|
Acoustic deterrents from aquaculture operations |
No |
Unlikely |
Steady but potential to increase |
|
Immunotoxicity |
No (but yes with marine mammals elsewhere) |
Yes |
Steady or increasing? |
|
Oil spills |
No (but yes with other populations) |
Yes |
Increasing? |
|
Reduction in prey base |
No (but yes with marine mammals elsewhere) |
Yes |
Decreasing for mammal-eating killer whales, unknown for fish-eating |
Figure Captions
Figure 1. Map showing world-wide distribution of killer whales. Shaded areas indicate records of sightings or strandings; however unshaded areas may be part of the normal range with no sightings documented. Map courtesy of Marilyn Dahlheim, National Marine Mammal Laboratory, NMFS, Seattle.
Figure 2. An adult female transient killer whale porpoising off Victoria, British Columbia, showing the main features for identification; the striking black and white colouration, a blunt head and a tall, centrally-placed dorsal fin. Photo by the author.
Figure 3. Photograph of two transient killer whales off Victoria, British Columbia, showing the clear sexual-size dimorphism, with the male (left) having a tall, straight dorsal fin and the female (right) having a shorter, falcate, dorsal fin. Photo by the author.
Figure 4. Morphological differences between residents (left) and transients (right) include differences in dorsal fin shape (with residents typically having more rounded fins) and saddle patch pigmentation patterns (with transients typically having less complex patterns). Overlap in the characteristics exist, so they cannot always be used to distinguish type. Photos by the author.

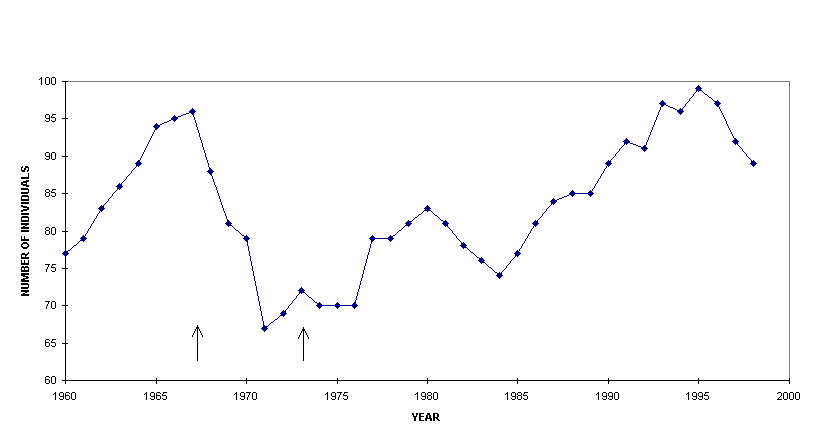
Figure 5. Population numbers and trends for southern resident killer whales. Data in this graph are from van Ginneken and Ellifrit (1998) and Olesiuk et al. (1990). Where differences exist between the two sources I have followed van Ginneken and Ellifrit (1998). The left arrow marks the beginning of large catches of whales from this population in the live capture fishery (small numbers had been taken prior to that point), while the right arrow marks the cessation of that fishery. Data from 1975 on are counts of animals using photo-identification; prior to that point numbers given are projections from a matrix model (Olesiuk et al. 1990). While there has been an increase since the end of live-captures, readers should compare the unsteady growth of this population since 1973, with the relatively steady continual increase of the northern resident population (Olesiuk et al. 1990; Figure 26).

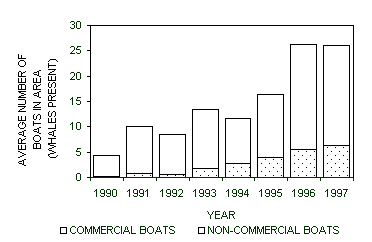
Figure 6. Trend in the average number of boats (both commercial whale watching operations and total boats) with southern resident killer whales as they pass the Lime Kiln Lighthouse on San Juan Island, Washington state, from 1990 through 1997. Data were collected from mid-May through mid-August each year, seven days per week, from 9 am till 5 pm. No such increasing trend was apparent when no whales were present. Data from R. Otis (see Baird et al. 1998b).